DESIGNER & MAKER / UX & UI & PROGRAMMING / SEP 2019 -DEC 2019
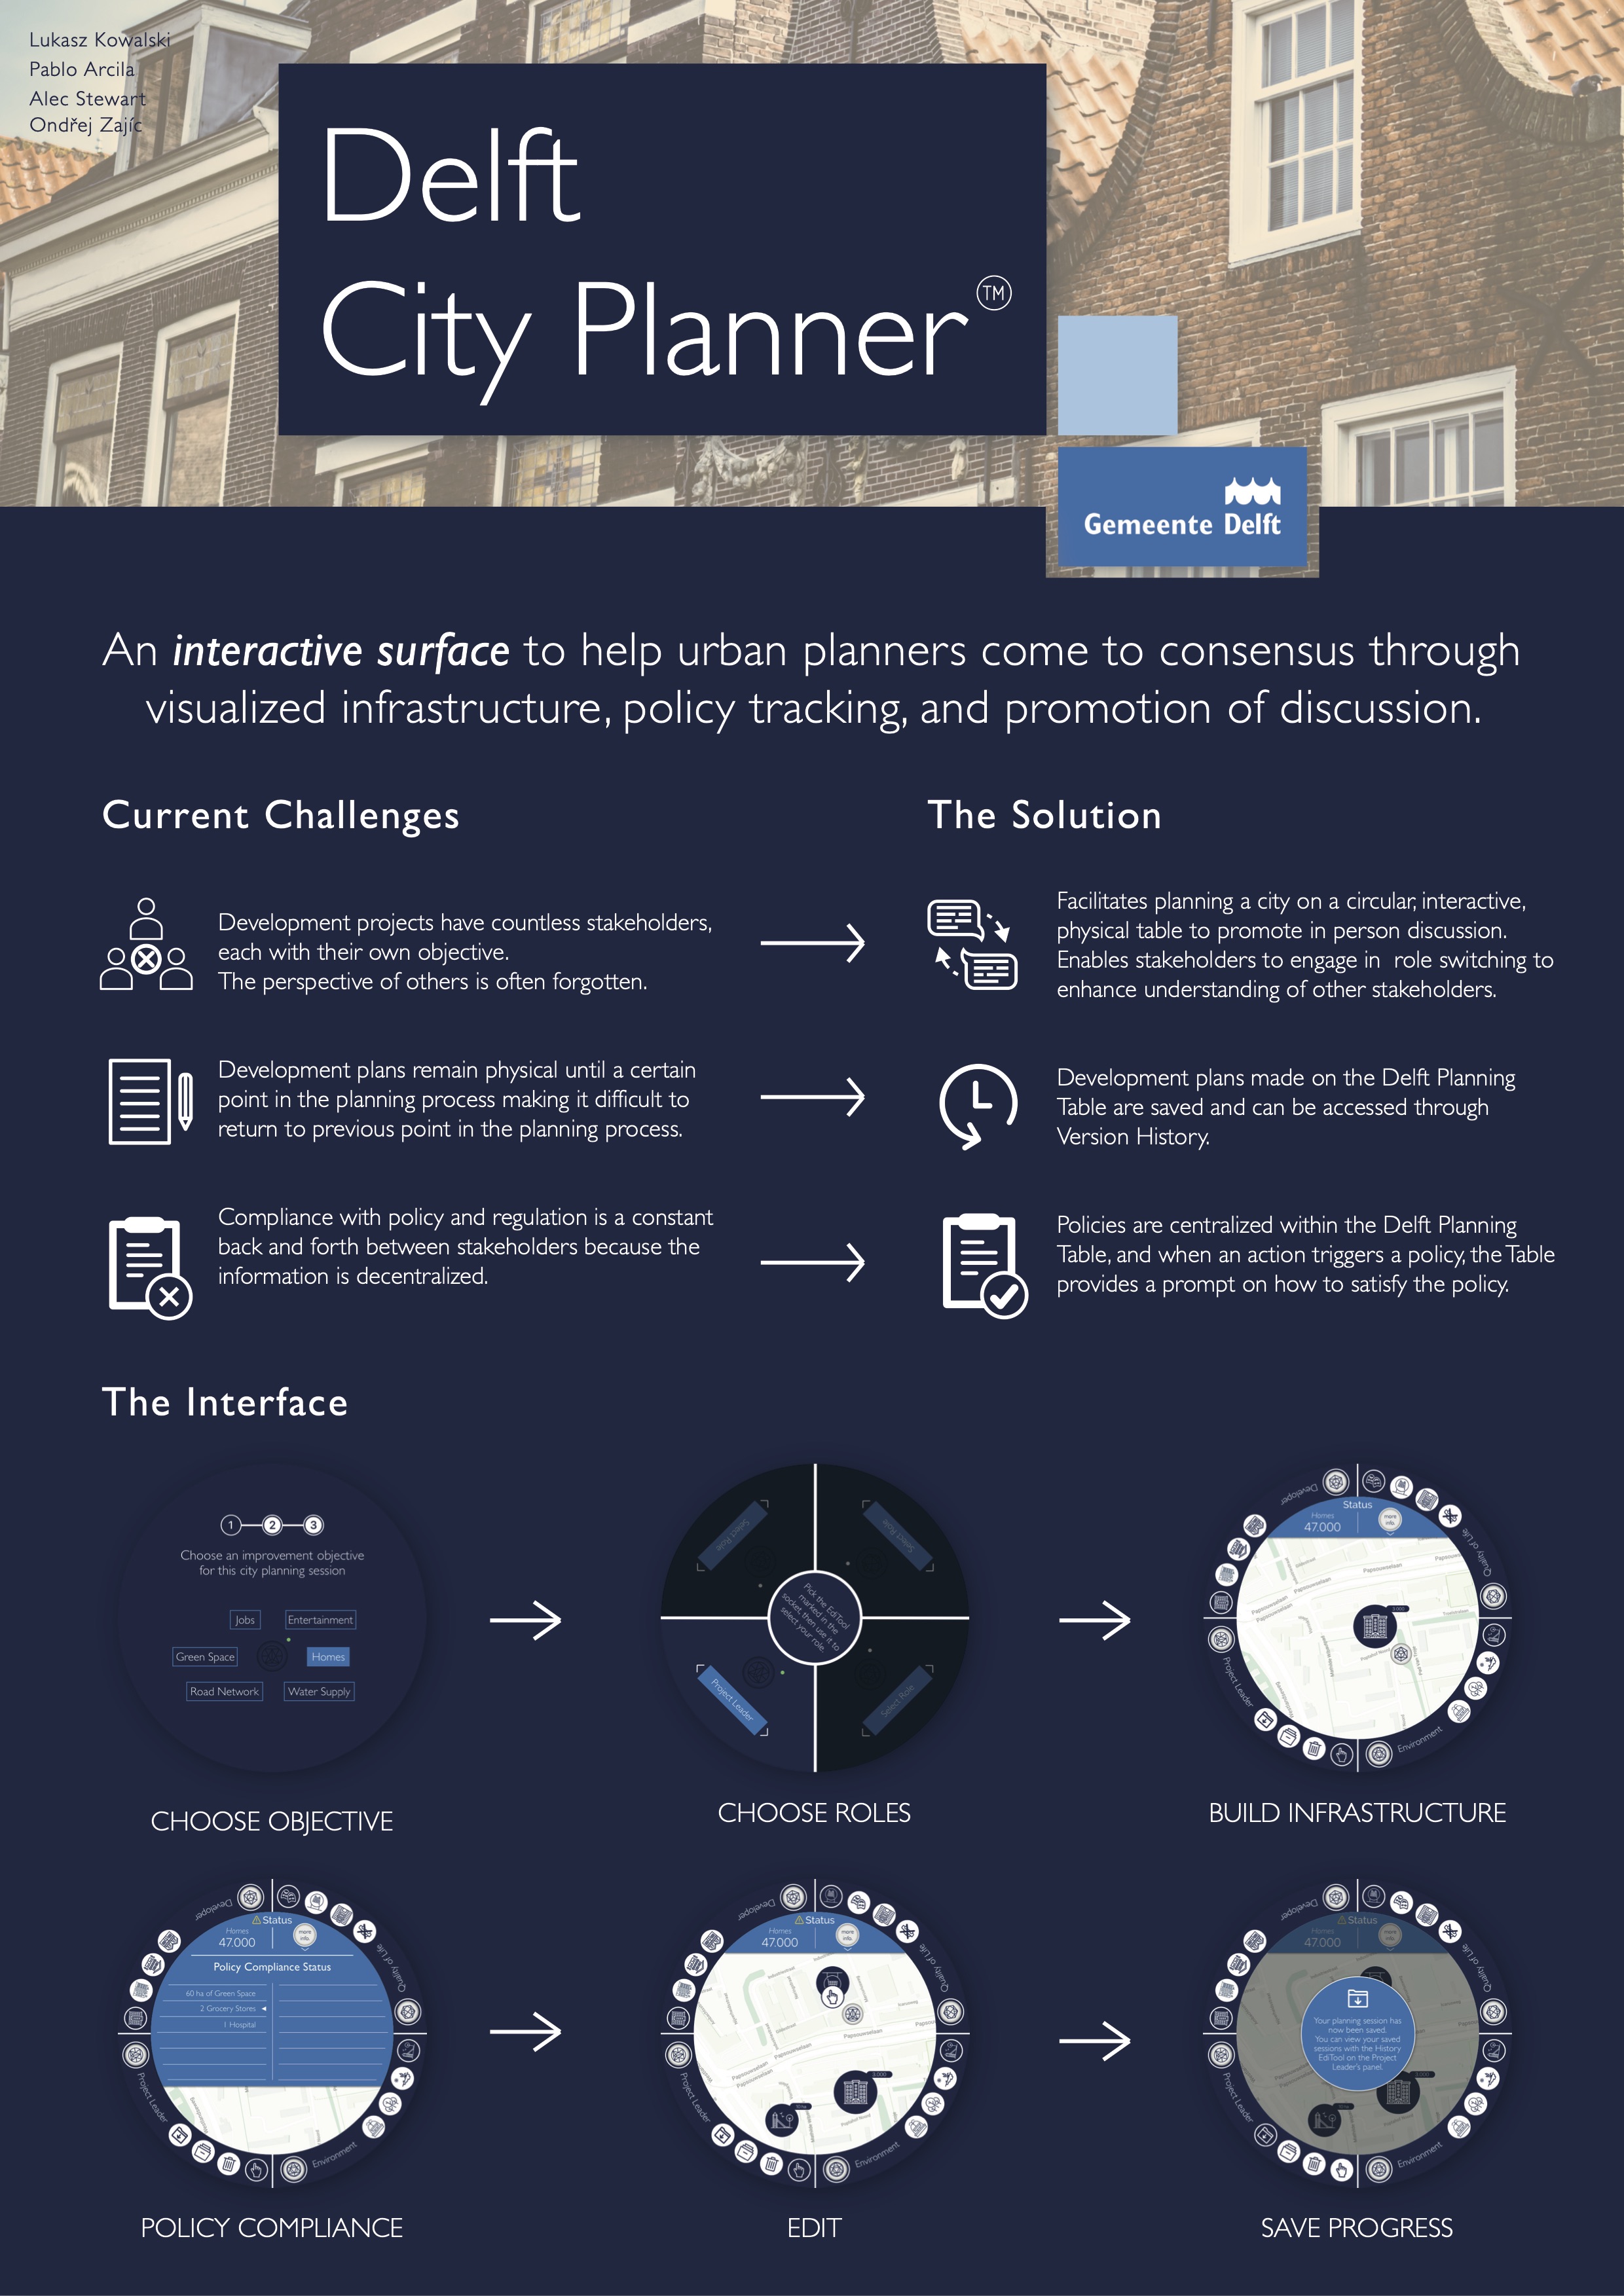
The municipality of Delft came to my school program, UXD at THUAS, wanting to create a Digital Twin of their city. They had a limited vision on what they wanted to do with this Digital Twin, just that they wanted one to exist and to reflect Delft through a digital medium. In collaboration with our client, we fleshed out a vision for the Gemeente ultimately creating an interactive table to assist with planning the development of Delft.
Issue: Participants have an underdeveloped ability to understand and reflect on their emotions.
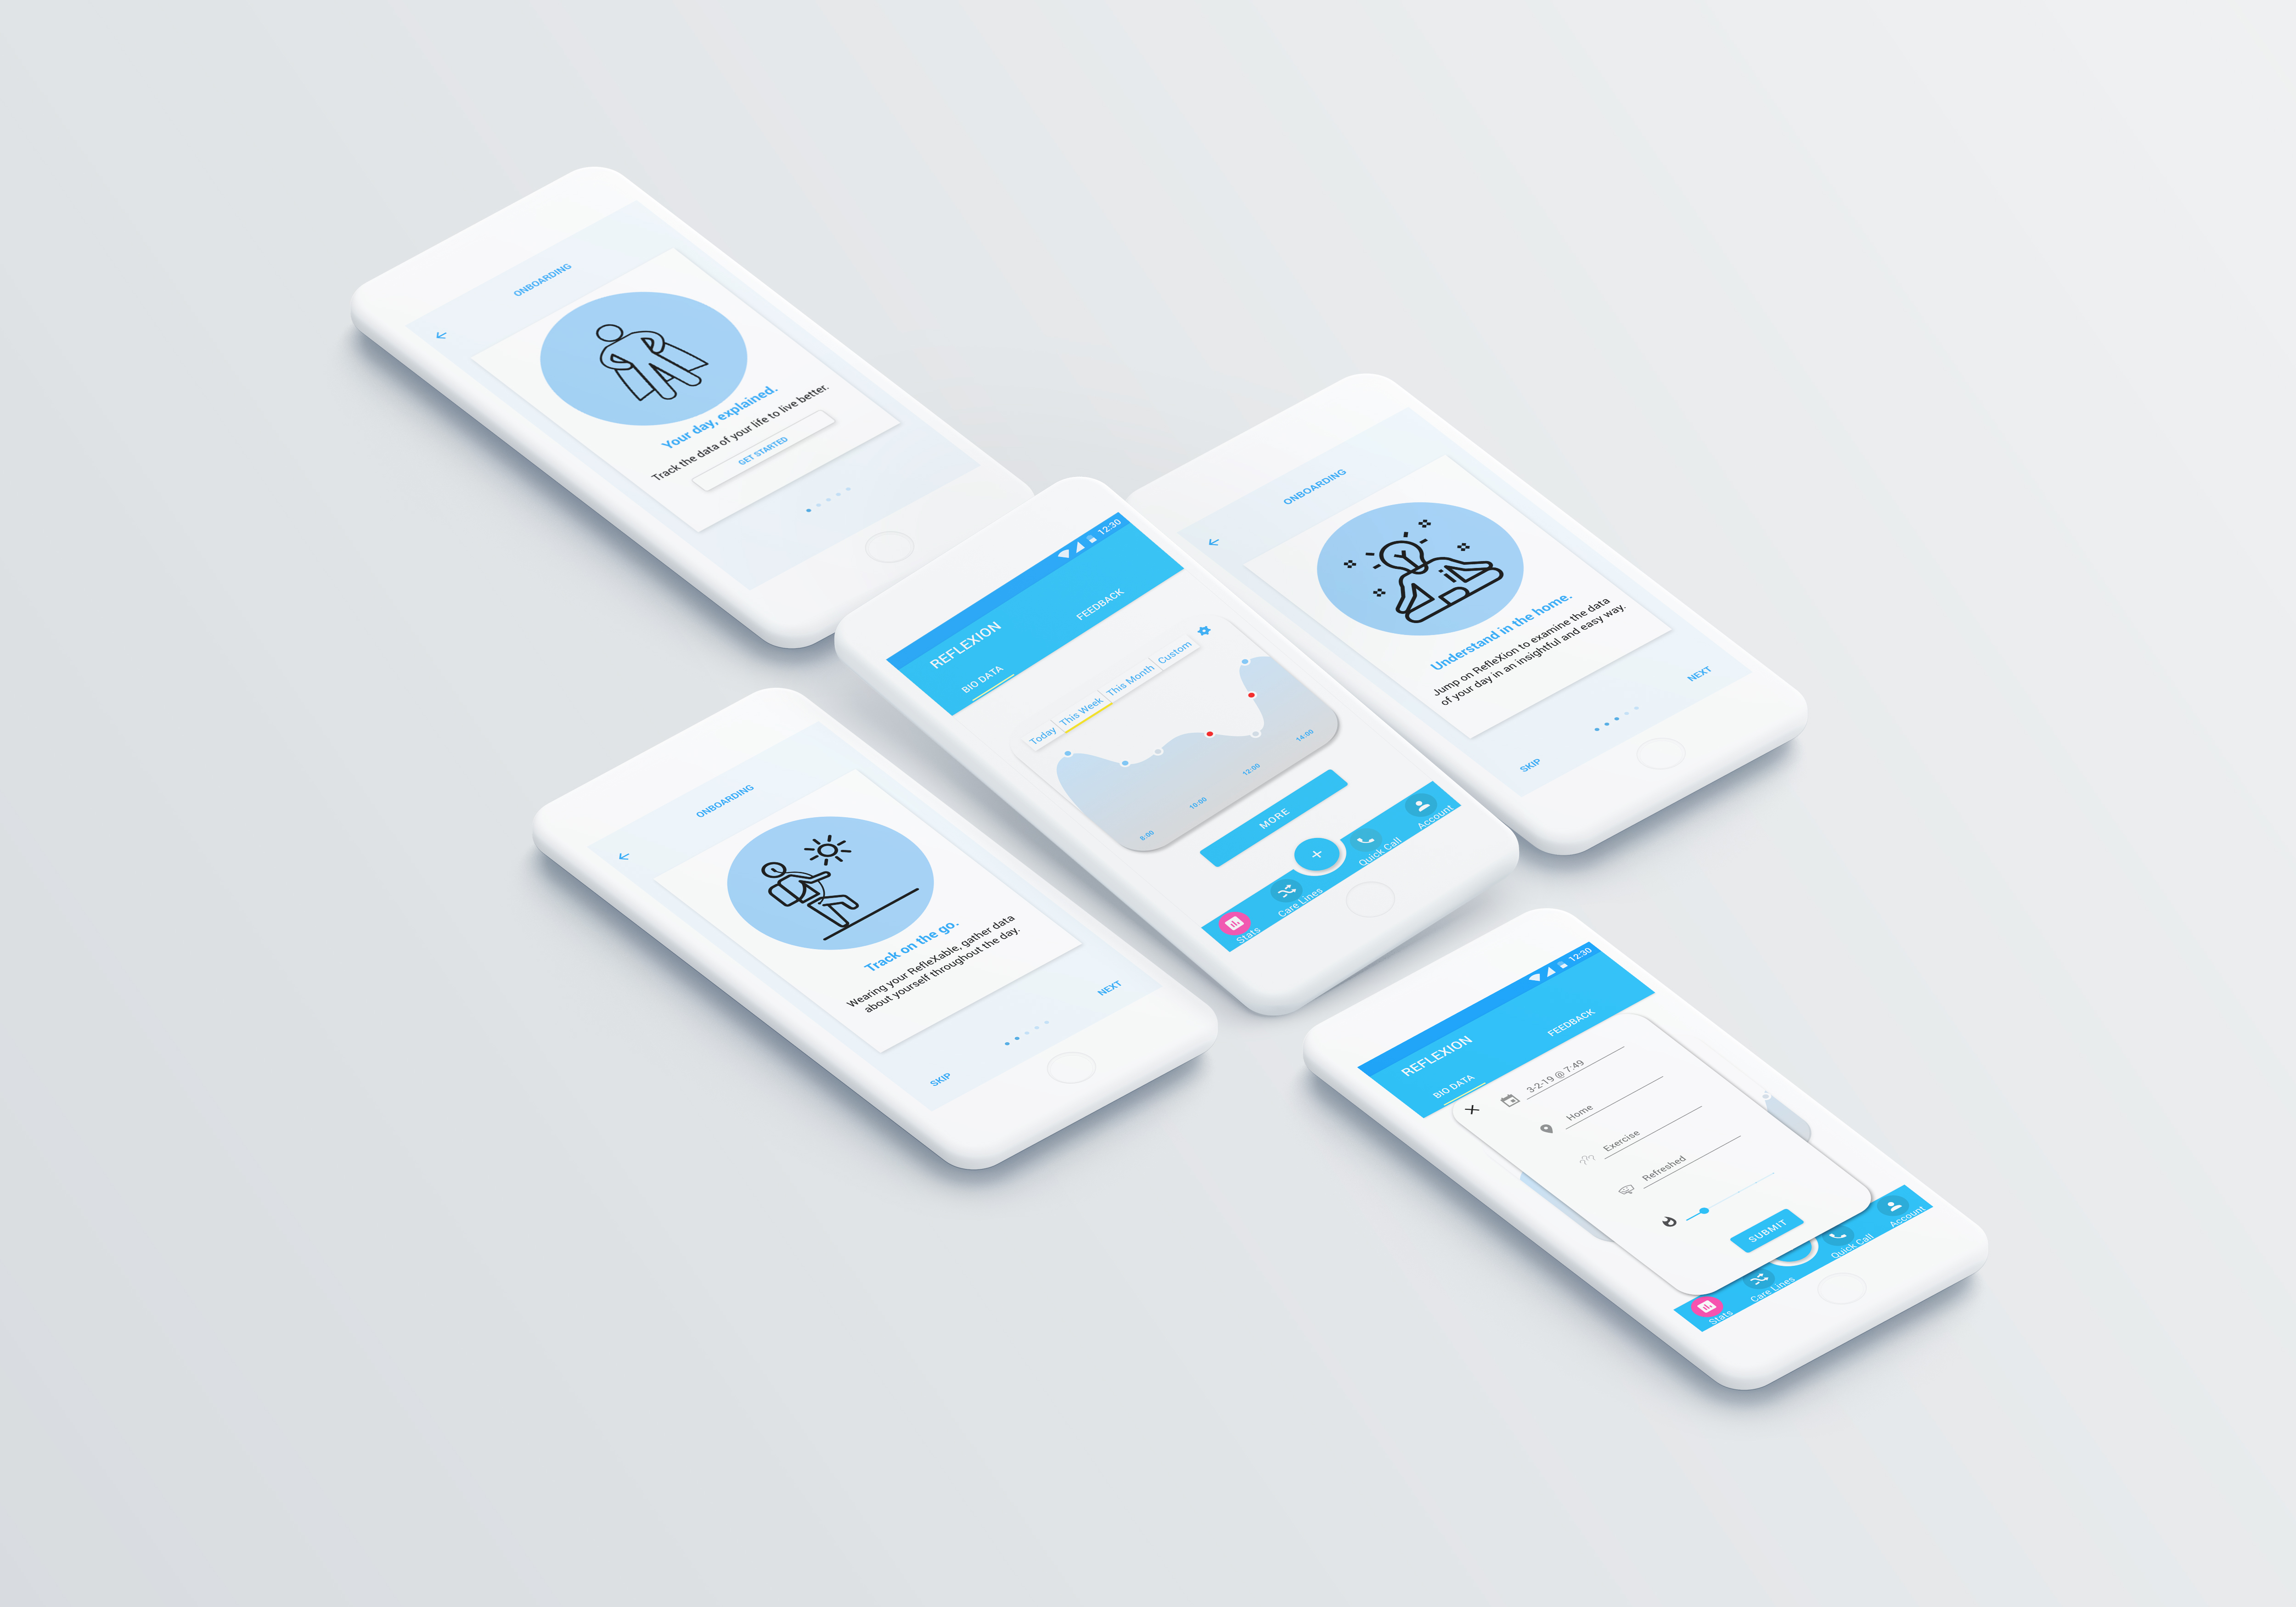
Being able to log significant moments within the application allows a participant to instantly recognize and provide detailed information on emotionally significant moments within their day. By logging these moments and providing context to them, a participant creates a repository of emotionally charged moments that can later be reflected on with their caretaker.
Issue: Participants have an underdeveloped ability to understand and reflect on their emotions.
Being able to log significant moments within the application allows a participant to instantly recognize and provide detailed information on emotionally significant moments within their day. By logging these moments and providing context to them, a participant creates a repository of emotionally charged moments that can later be reflected on with their caretaker.
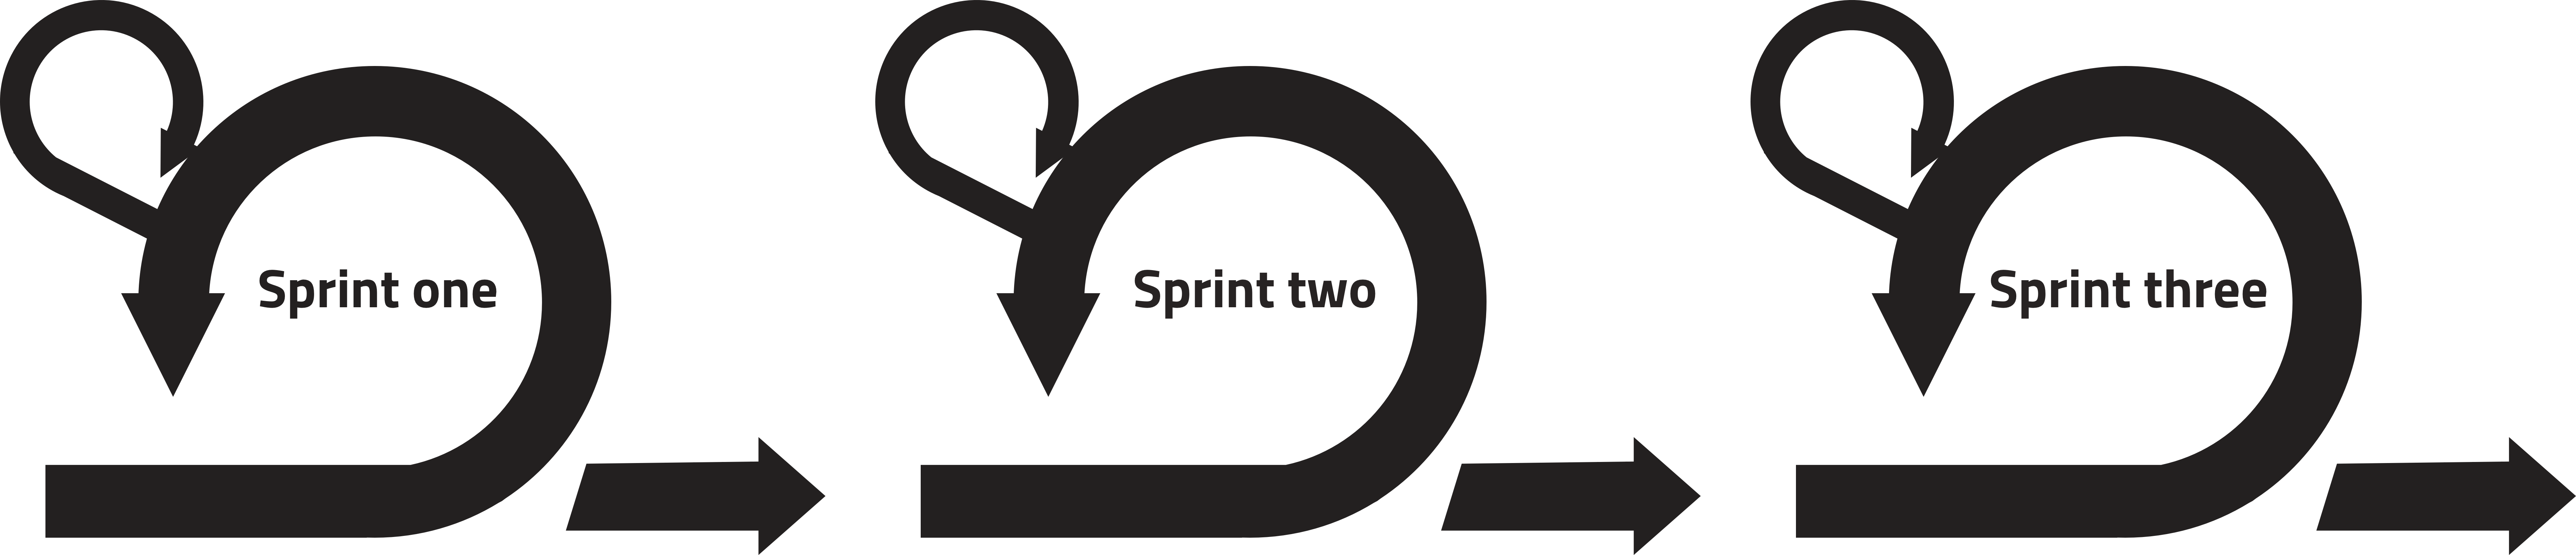
The team used SCRUM for this project, having 3 separate sprints each being 3 weeks long. Having prior experience with SCRUM, I felt at home using it, and implemented some methods within our process including Burndown charts and planning poker which helped the team to plan and have an overview of each sprint.
Through several interviews of city planners, that I led, the team discovered that one of our client’s chief pain points was the map making portion of planning Delft. City planners use physical maps on which they draw rough concepts to begin making basic plans for development projects.
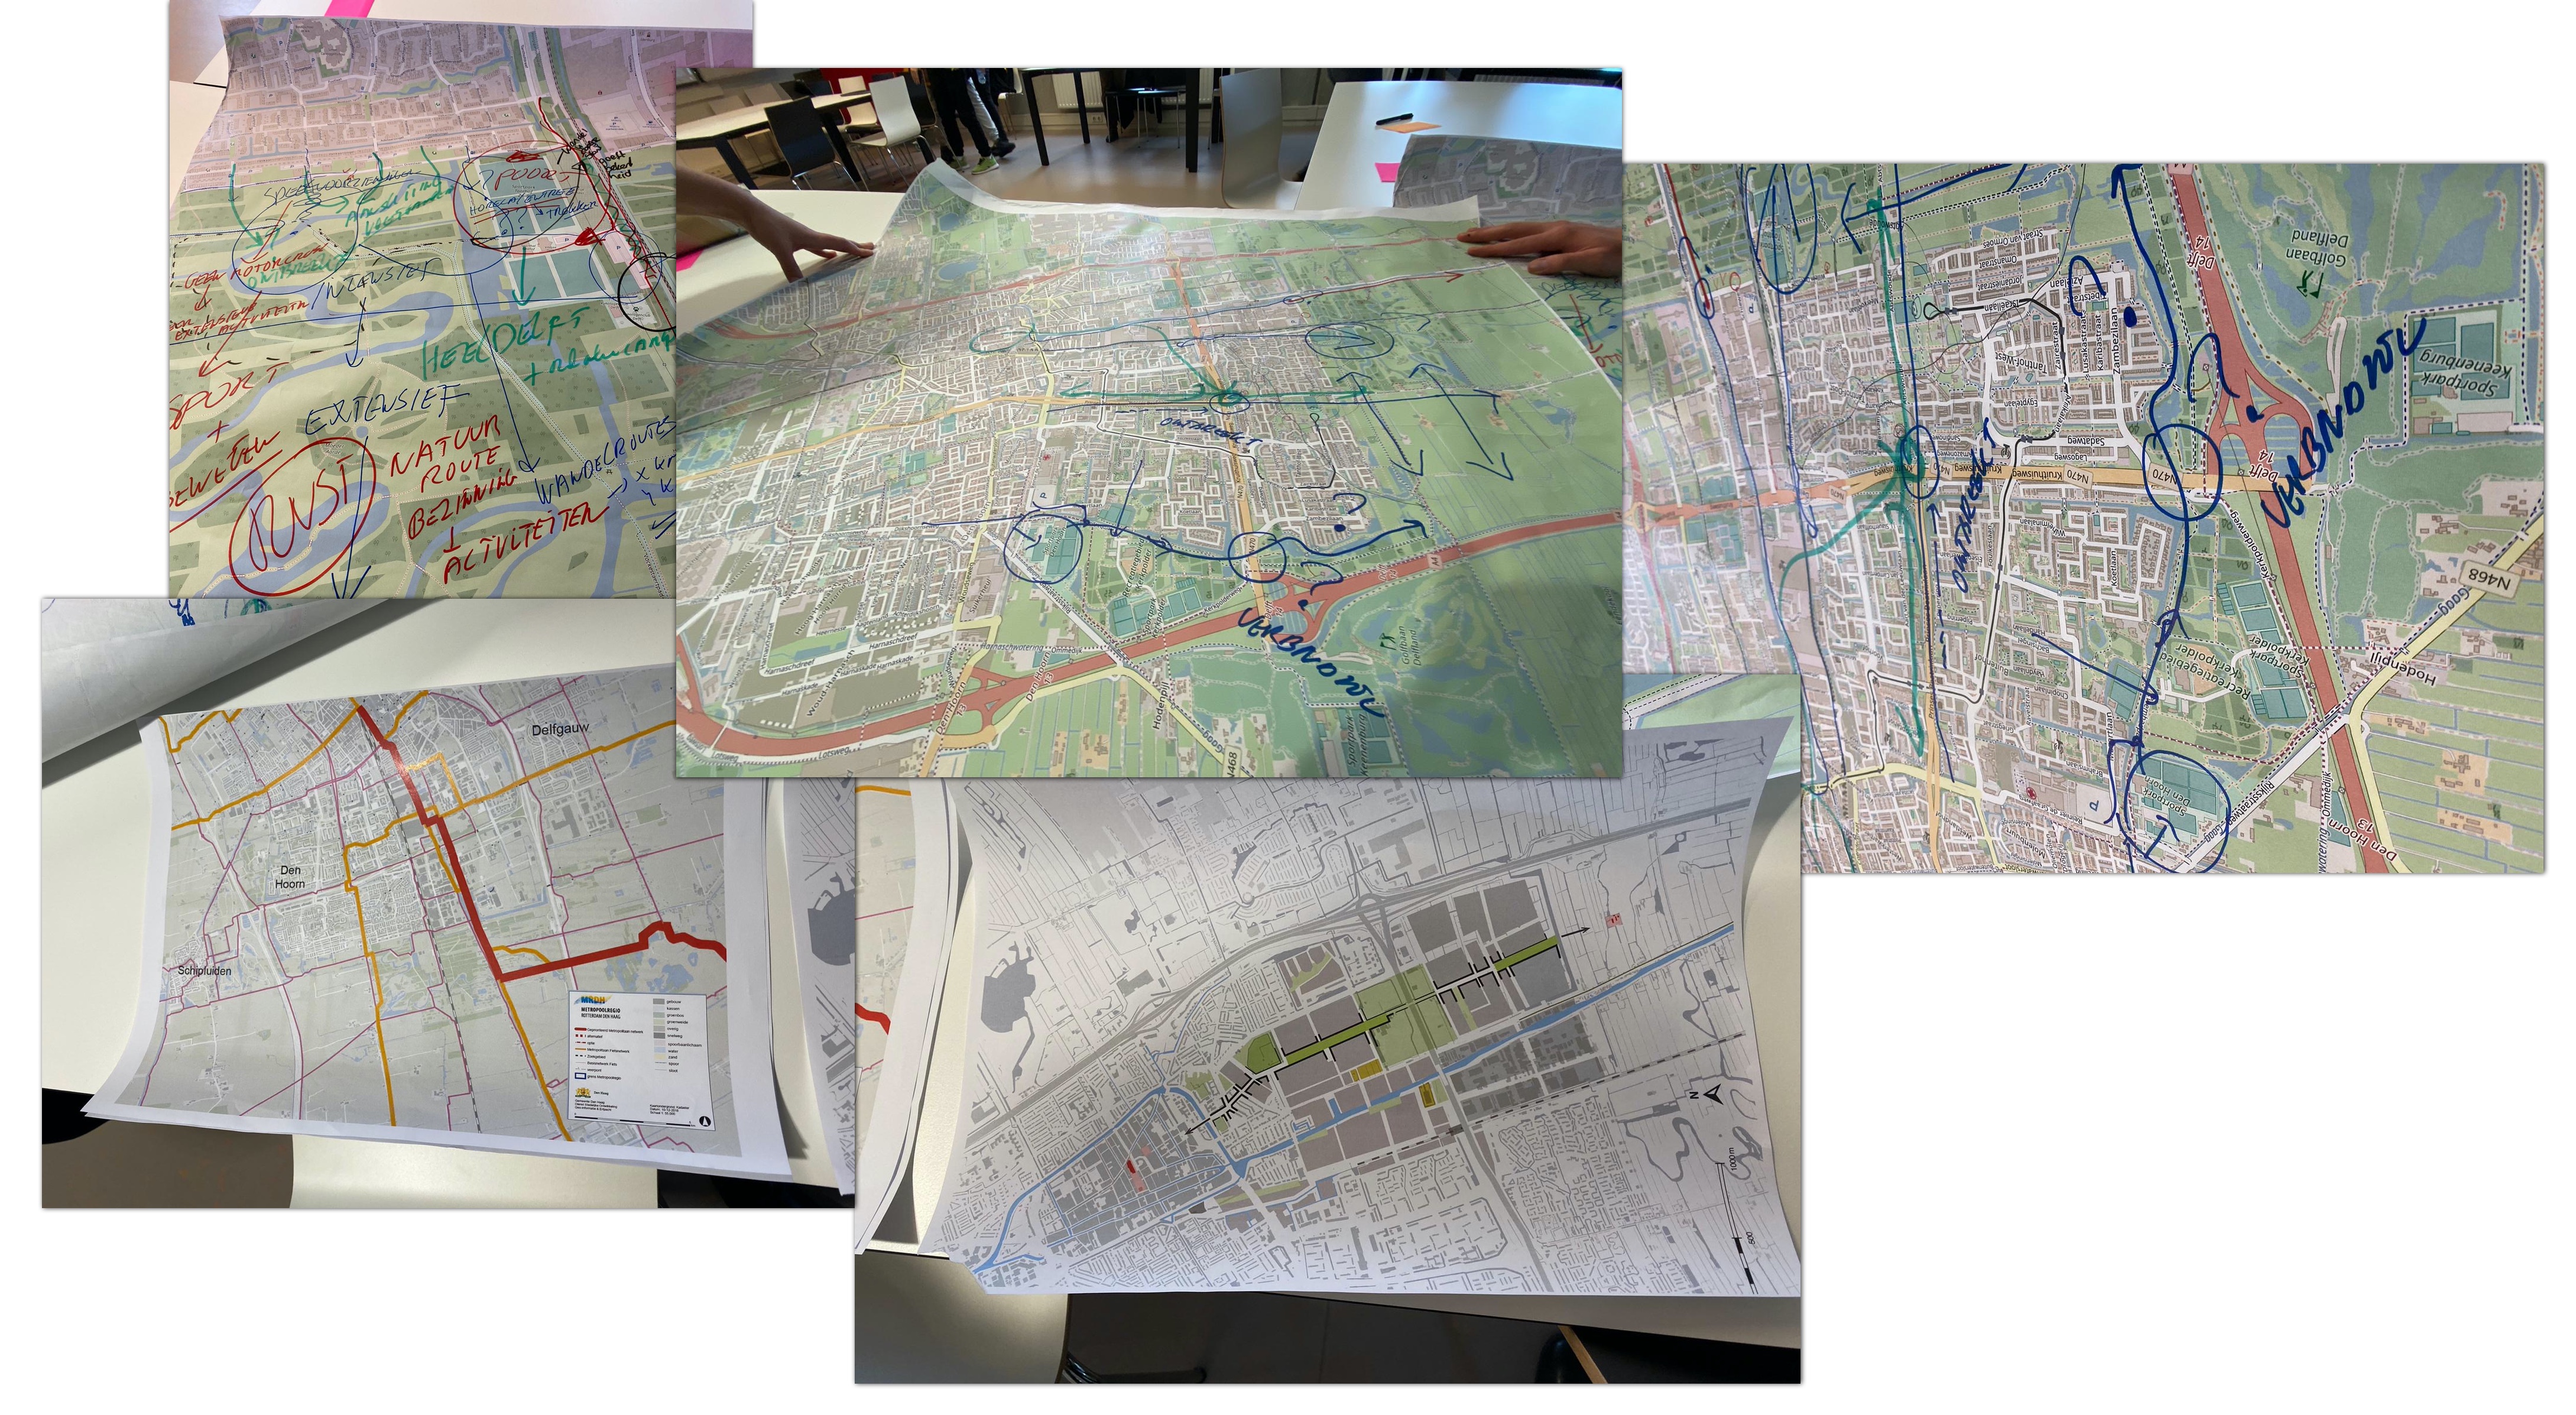
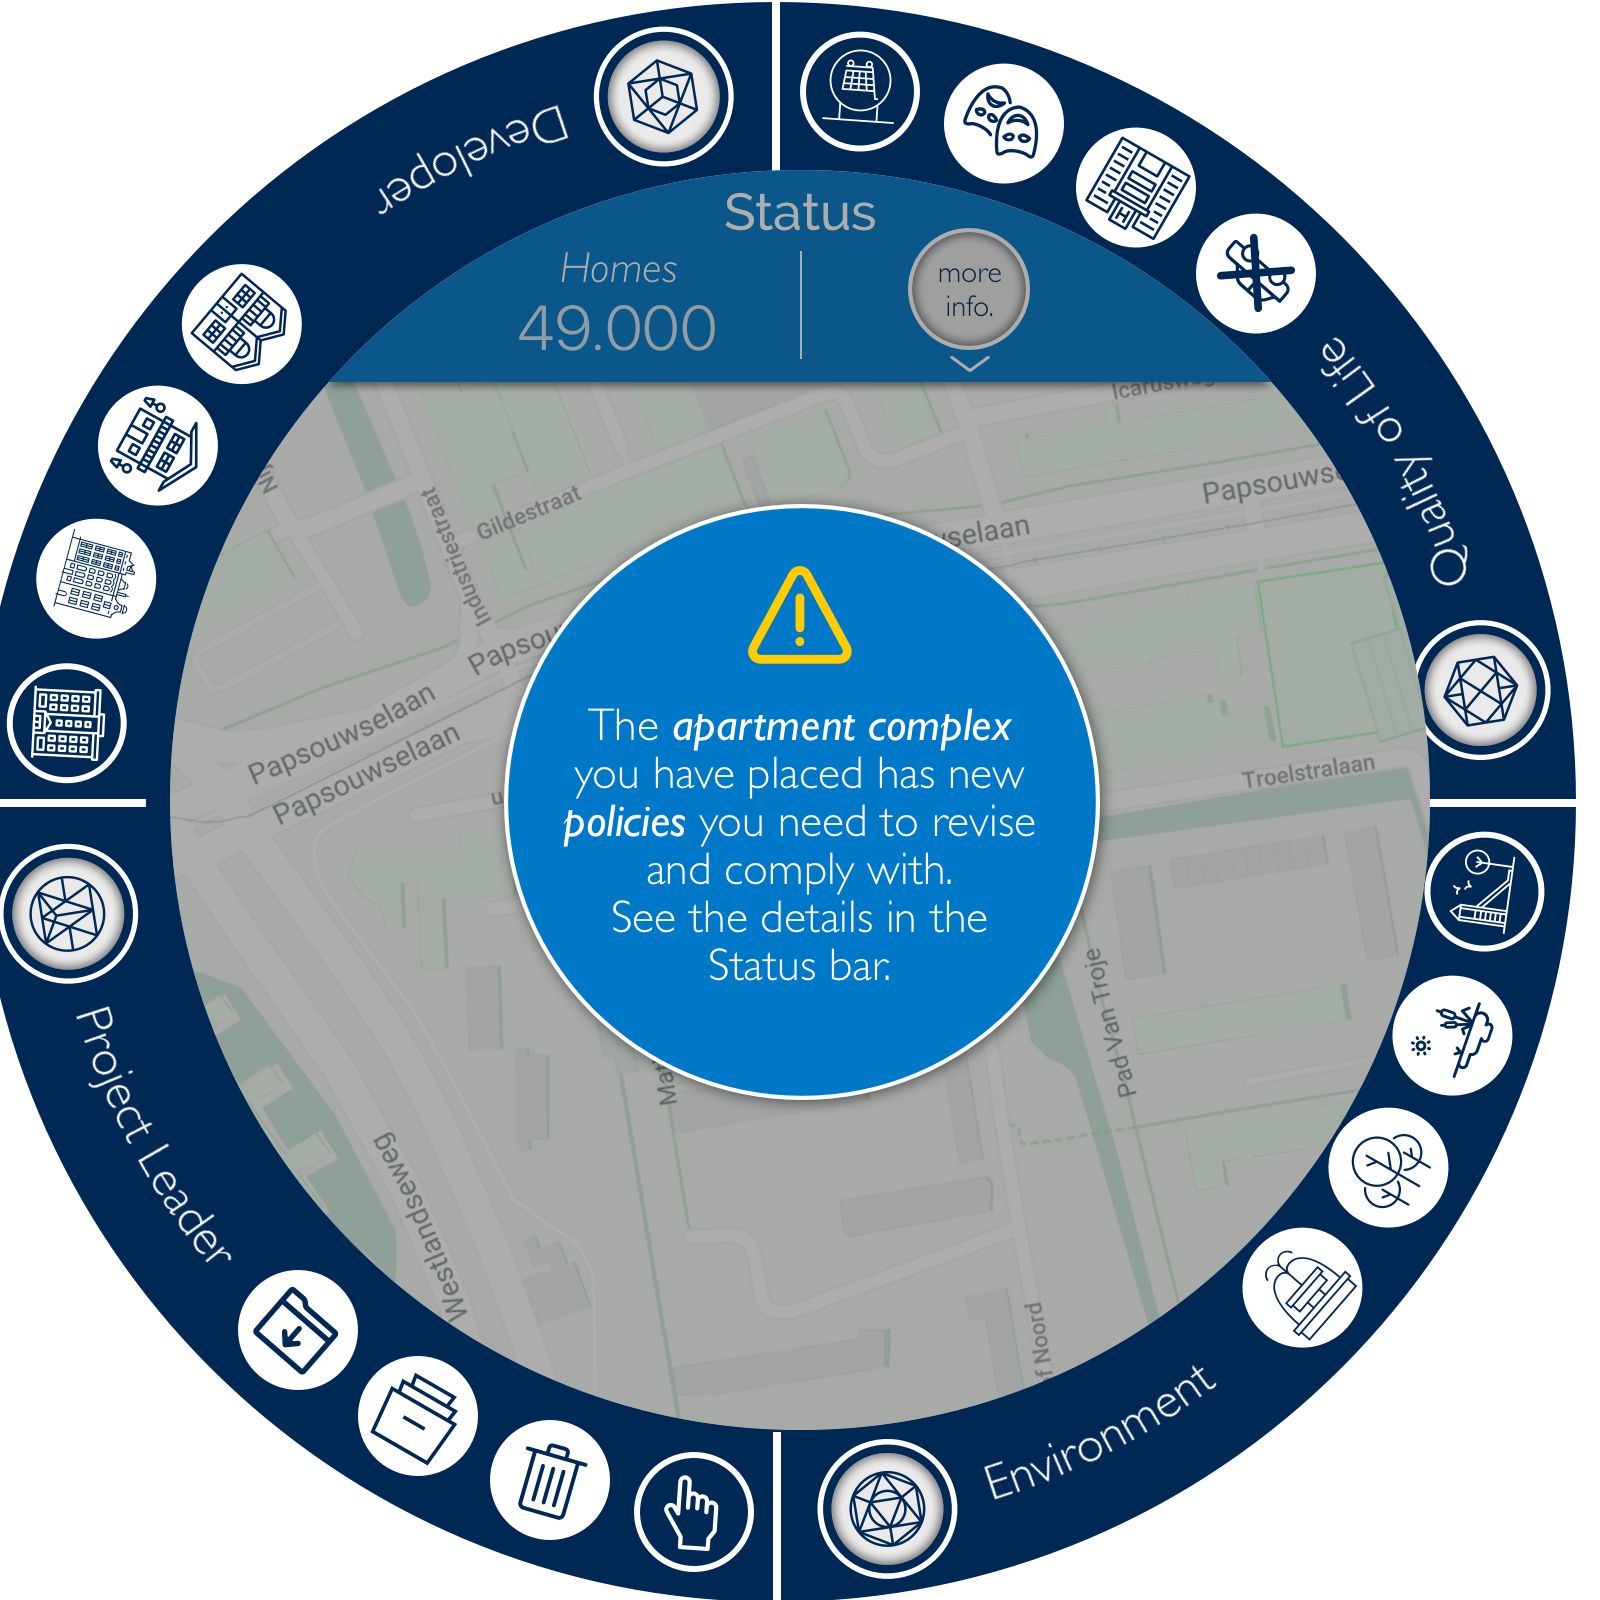
This process of using physical maps during the many stages of urban planning creates several issues for the city planners. For one, policies that must be complied with are not taken into account until later in the development process. Secondly, ‘editing’ these physical maps is not effective. Thirdly, having only one copy of these plans is less than ideal as there are many stakeholders involved and only one copy of the maps. After learning about our user's pain points, the team decided to pivot our mission to focus on revolutionizing the map making portion of city planning by modernizing it through an interactive digital map in which infrastructure could be placed and edited on the map, parameters could be set, and development policies could be checked.
In order to understand the specific needs of city planners in regards to map making, I held three interviews with city planners and one interview with a map digitizer. The meeting provided a few key insights.
Key activities: Programming Fiducial Marker Tracking, Designing Lo Fi Screens (Me), Building Projector Rigging and Table (Me)
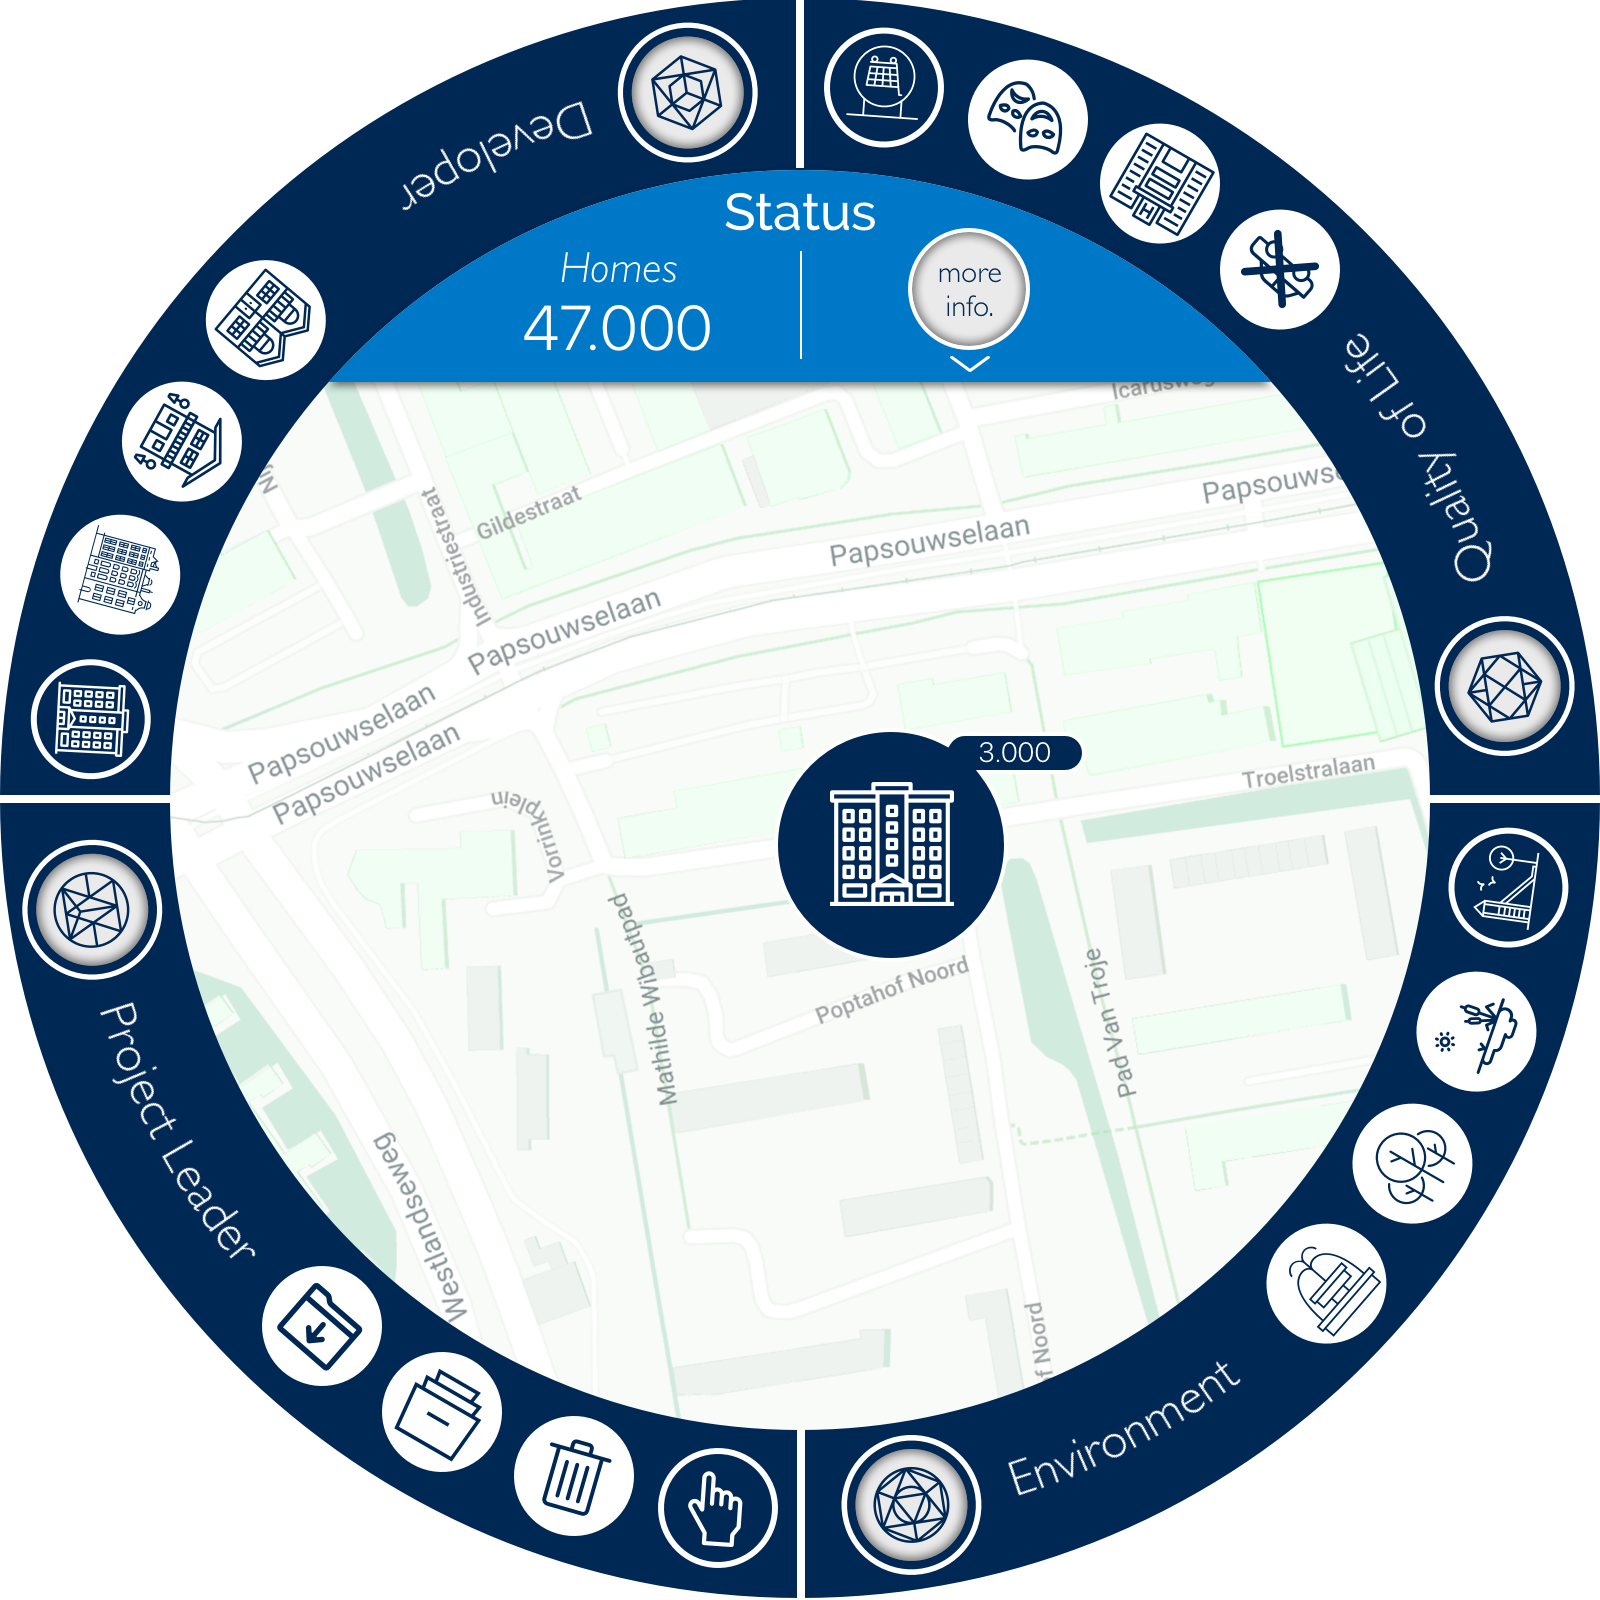
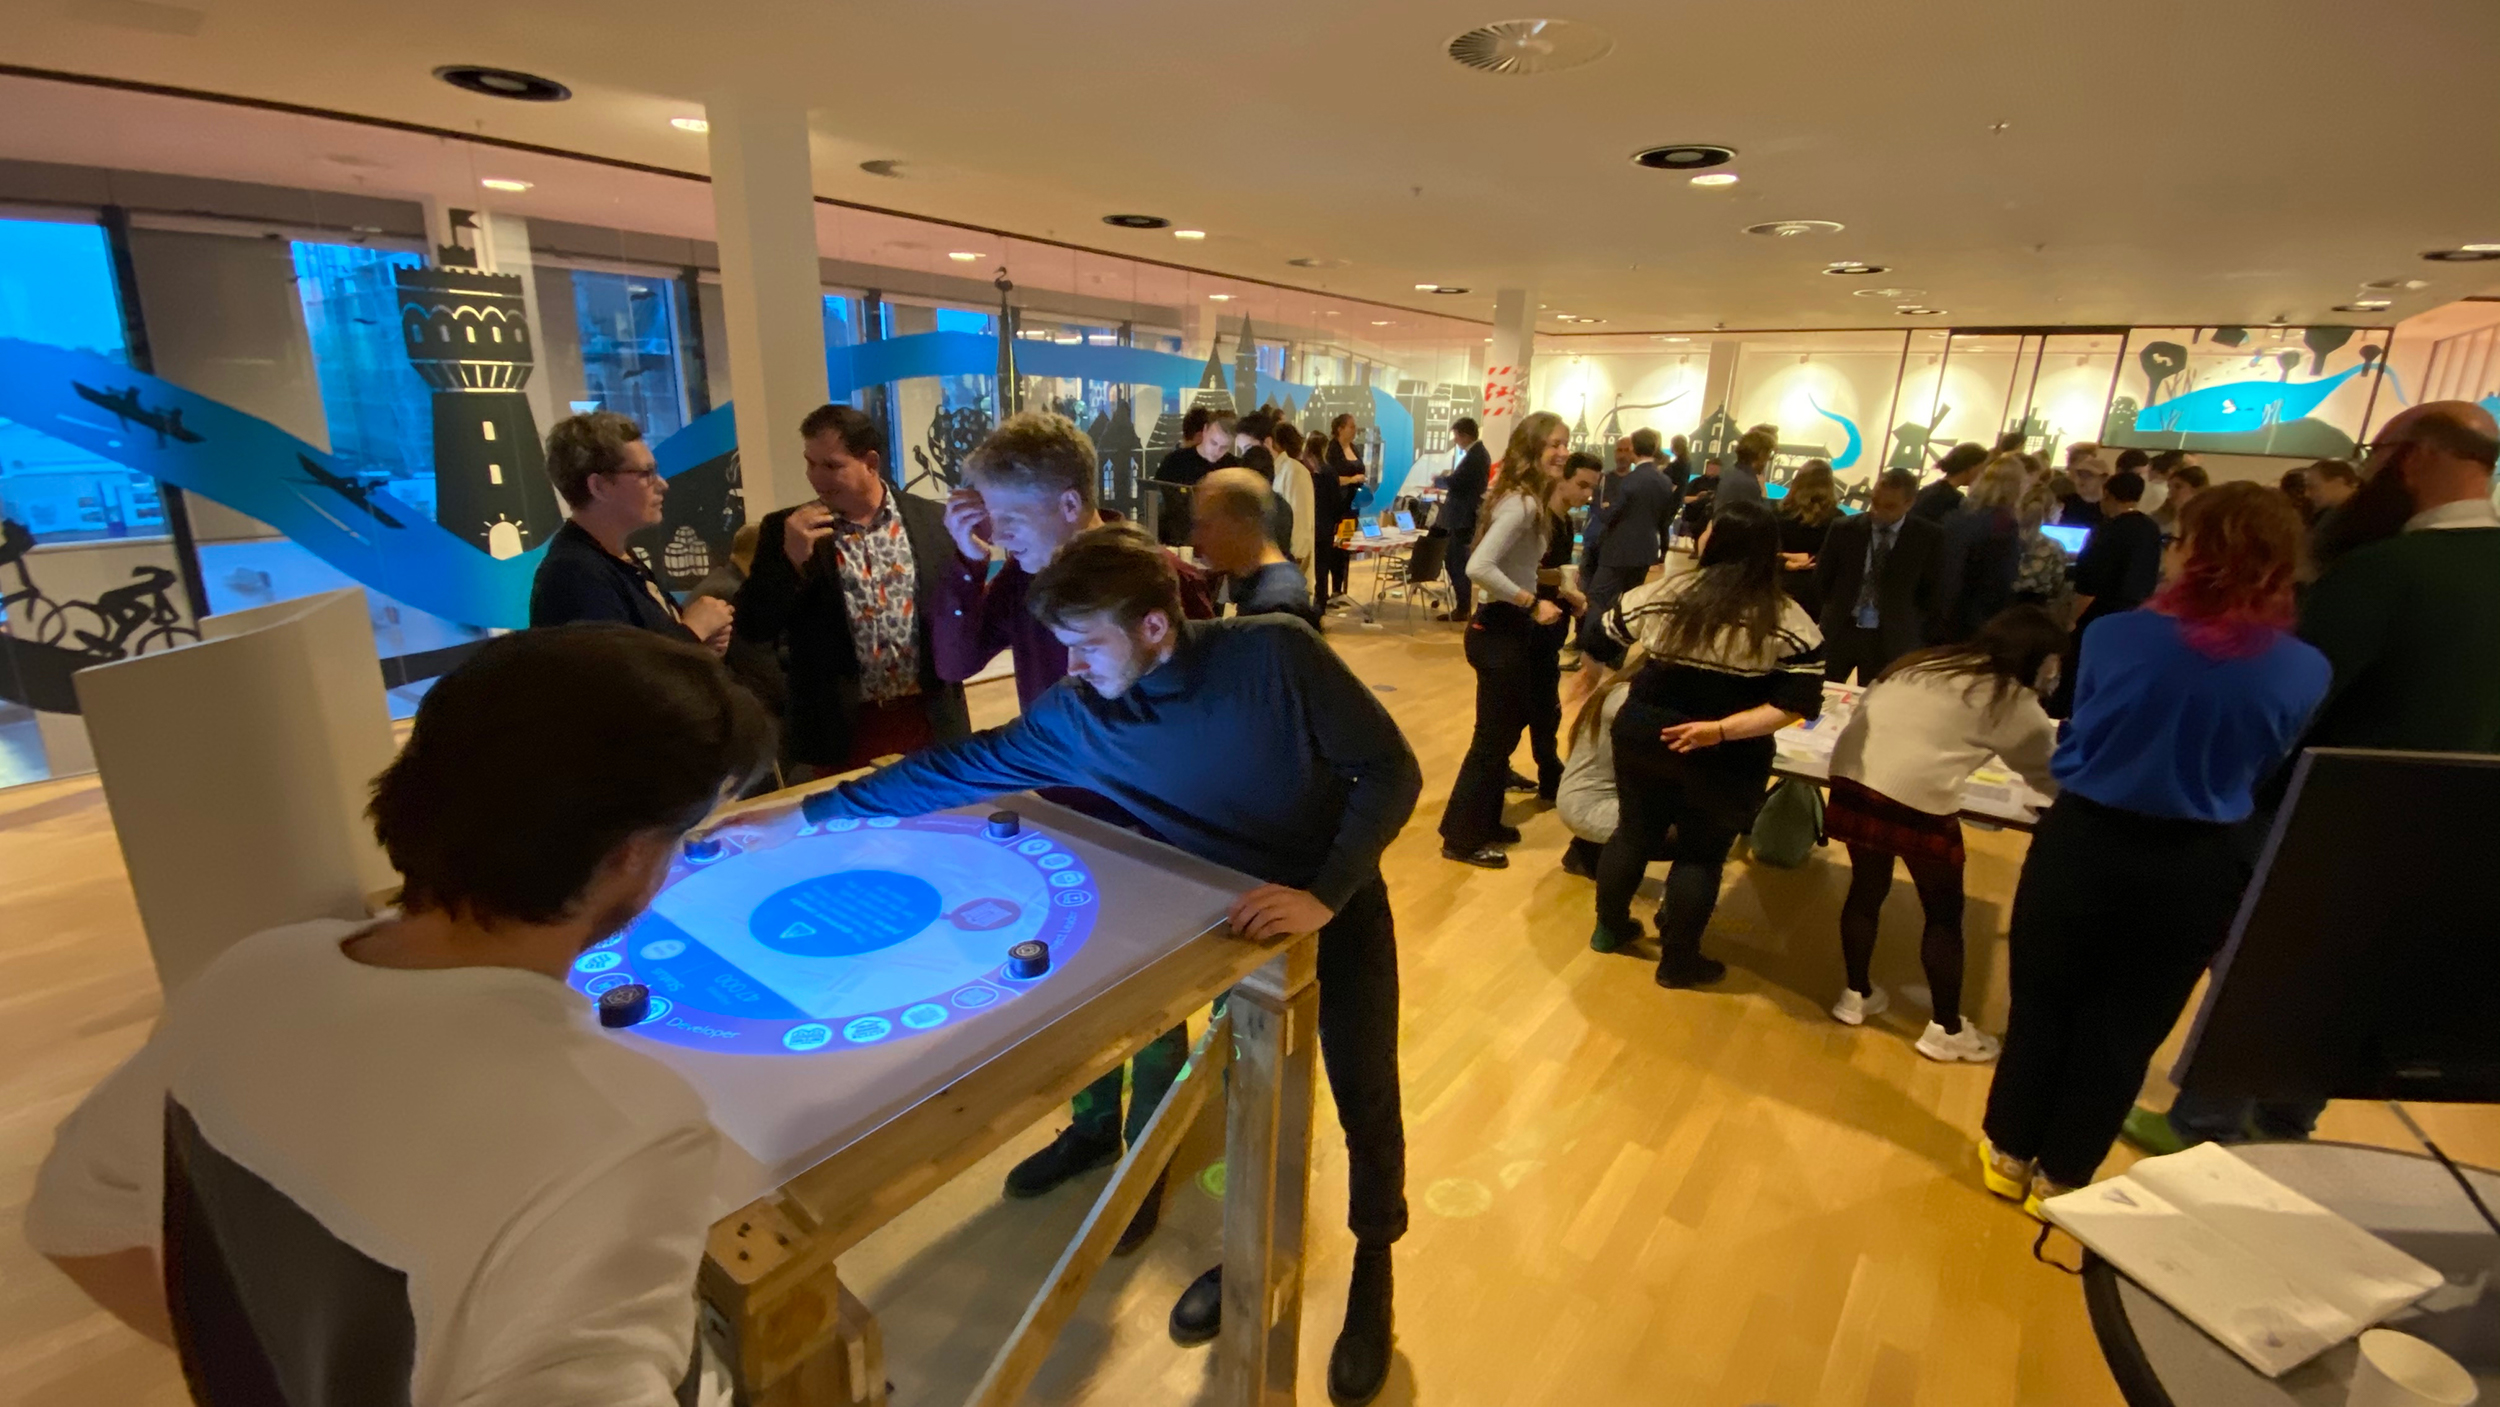
The team developed an iteration of the interactive table that would finally result in the Delft City Planner.
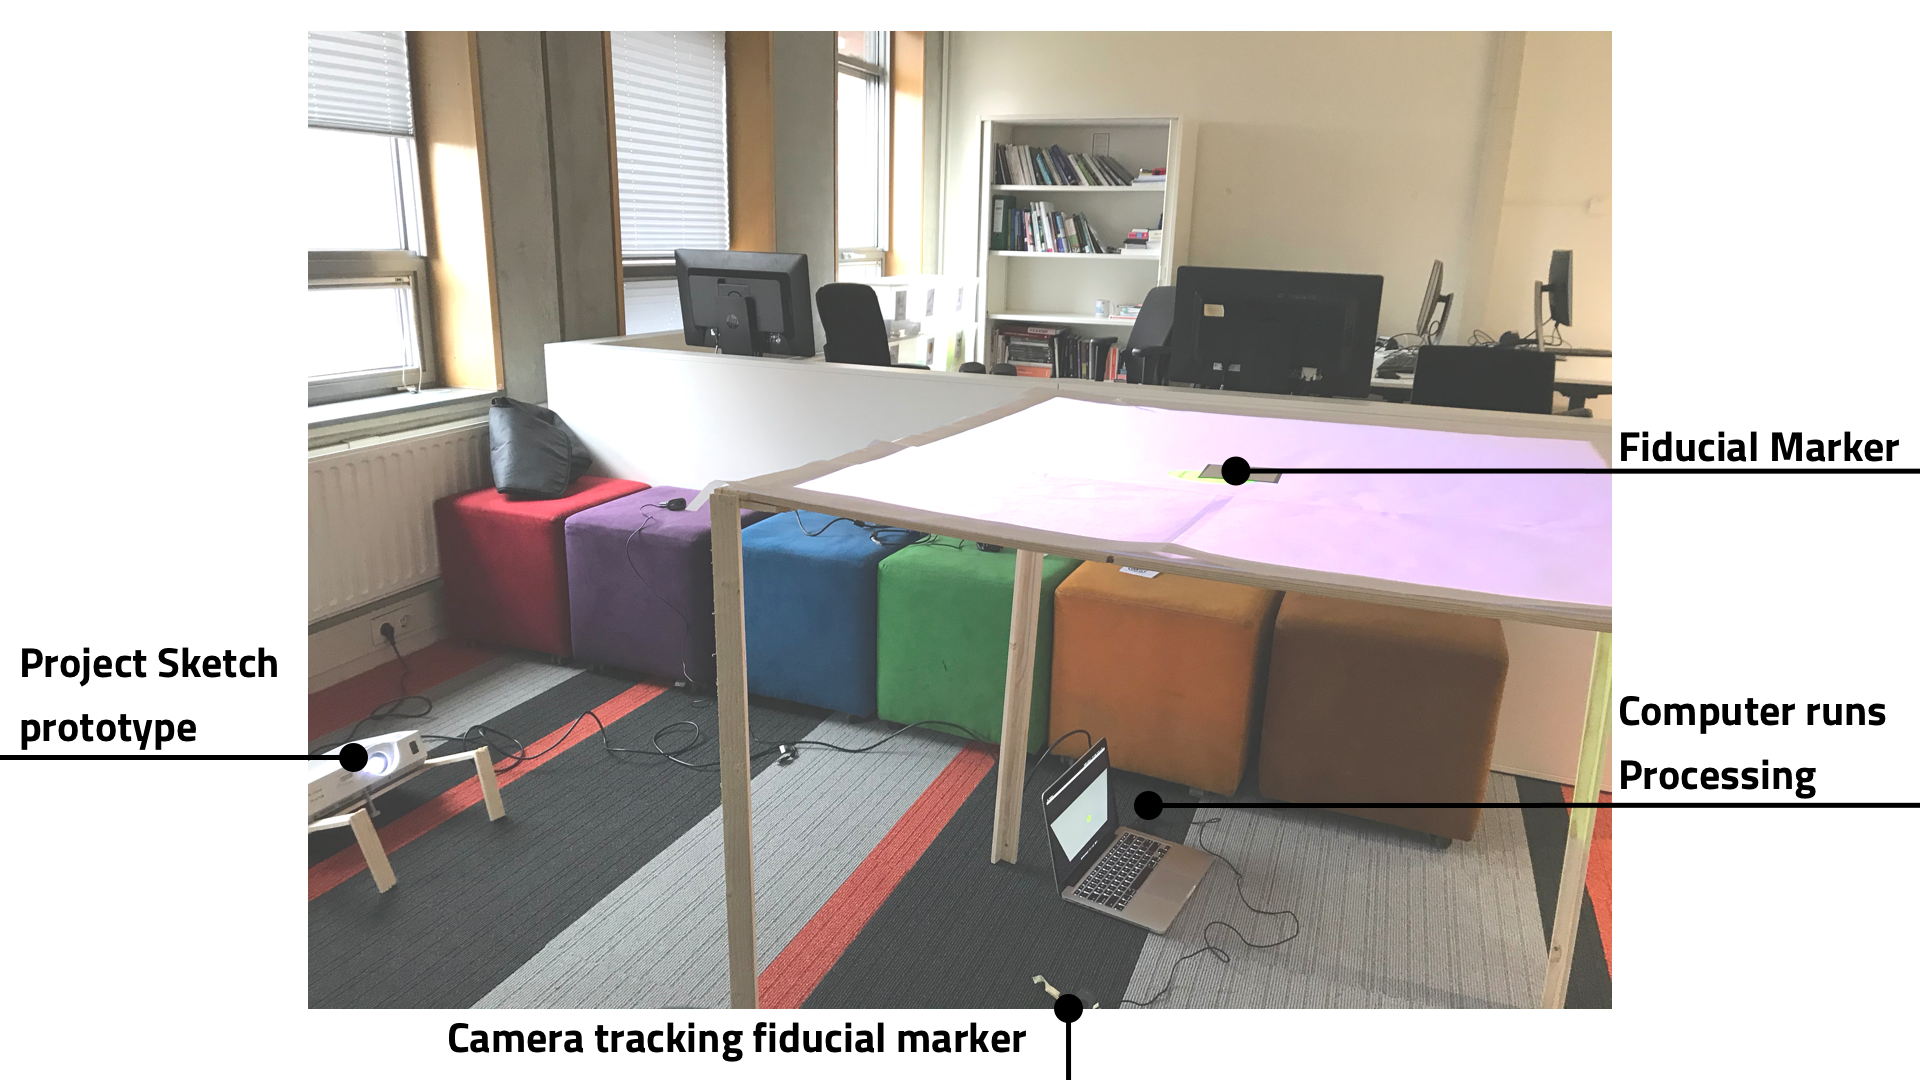
The table works by a Computer Vision program tracking fiducial markers on the table. A fiducial marker is a marker that can be identified by any kind of imaging system. Using these markers, we were able to create interactions within our program in Processing that reacted to the location and angle of the fiducial markers. I created Tokens from the fiducial markers which would be used by users to interact with the table. The tokens had a fiducial marker on the bottom and an identifying icon on the top so users knew which token was theirs throughout the session.
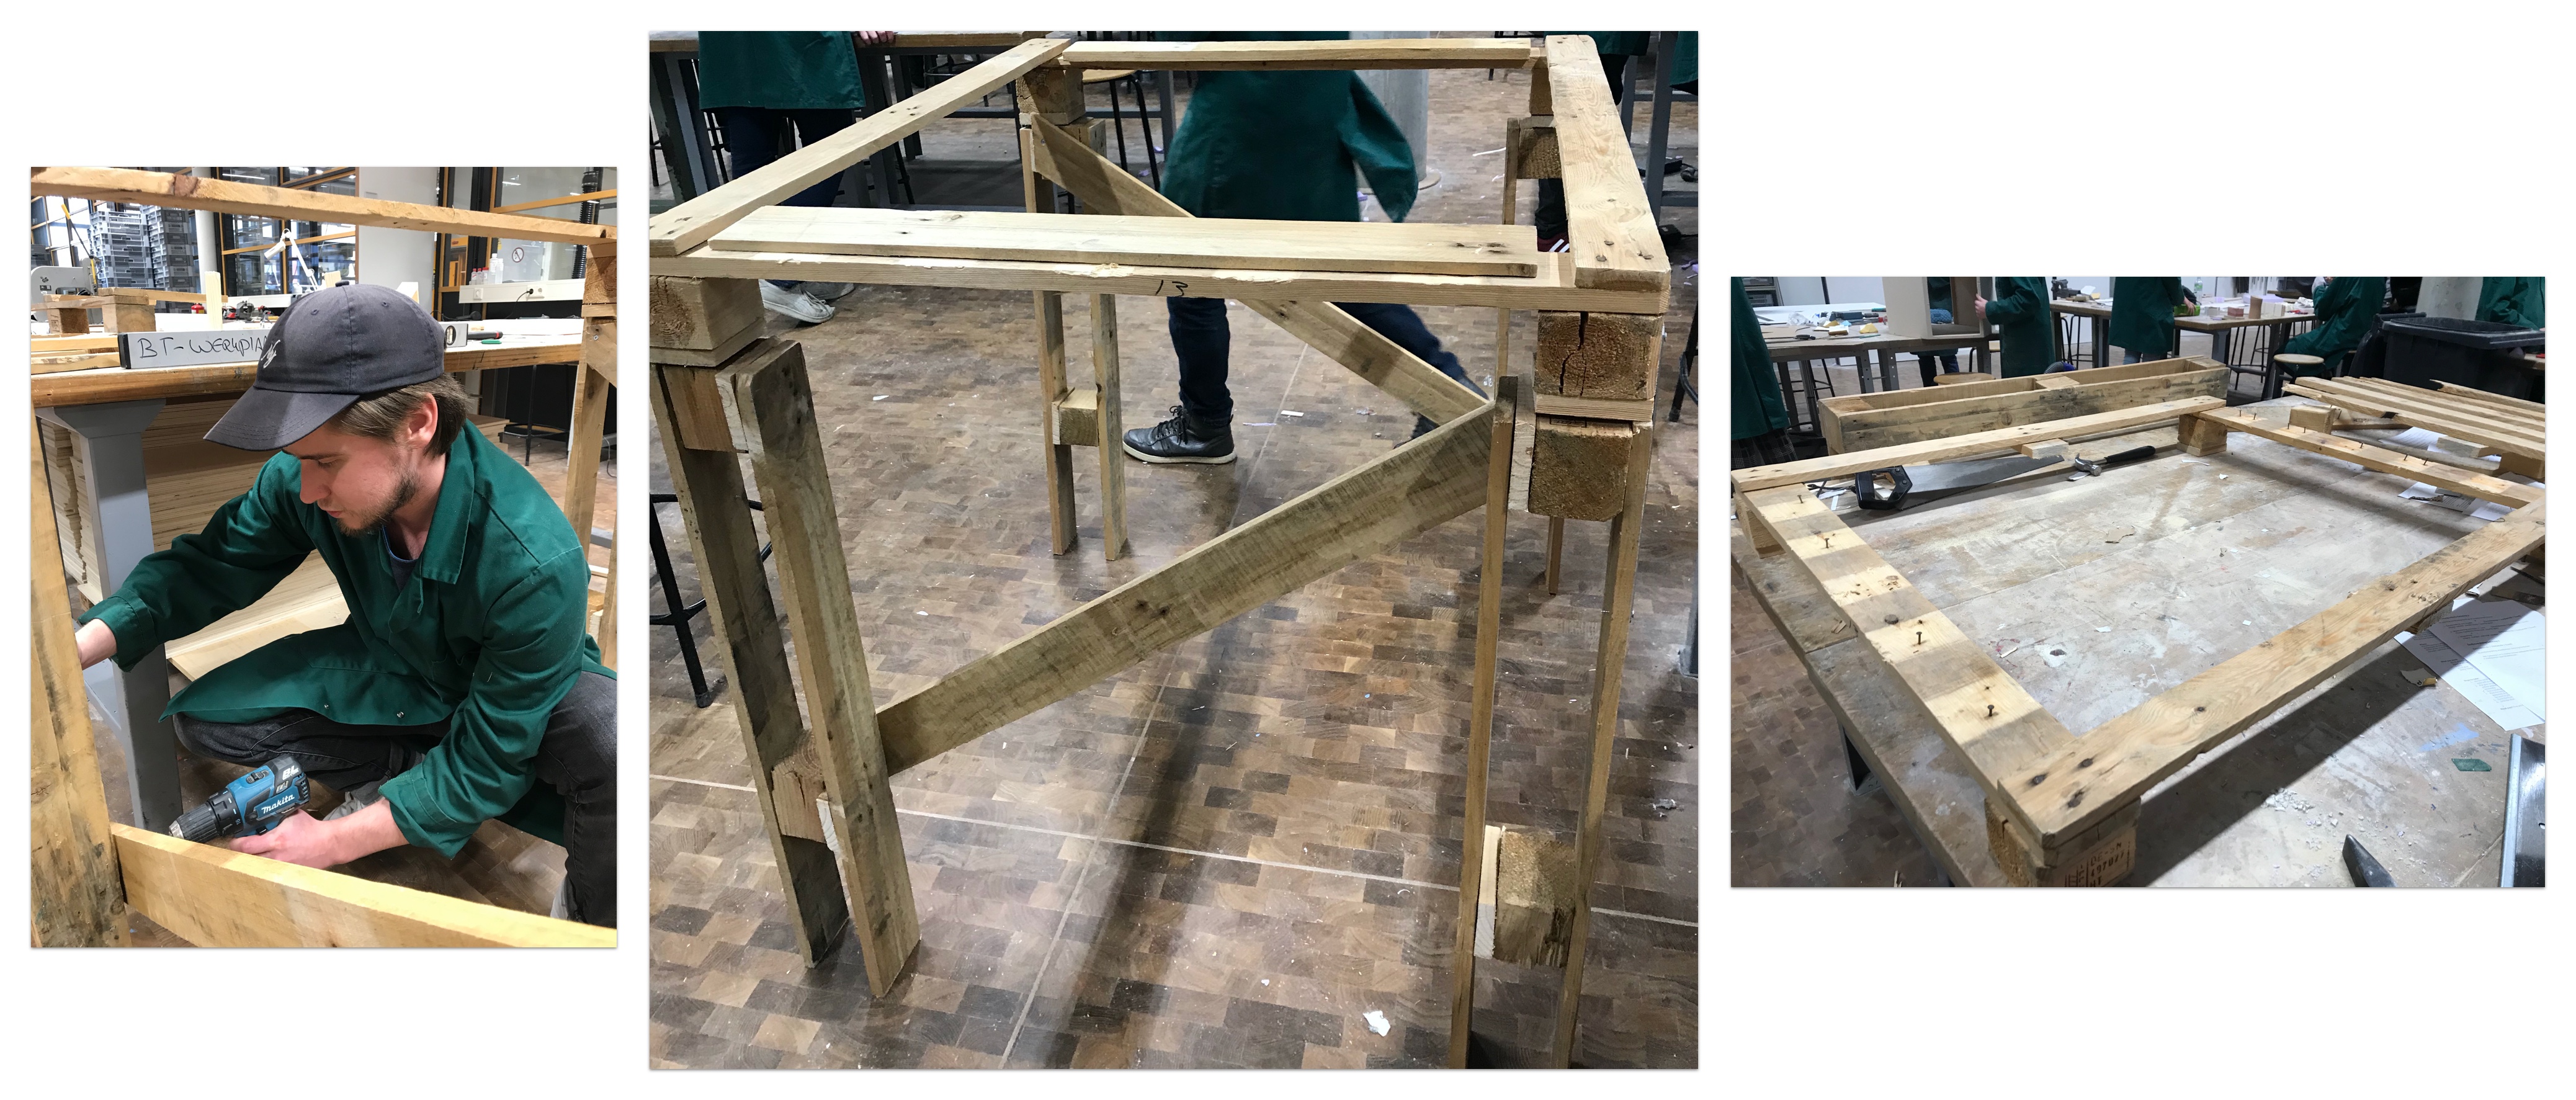
Key activities: Designing High Fidelity screens (Me), Creating a Sturdier table (Me), Fine tuning the Computer Vision program, Reworking the user flows (Group)
In the second iteration of the prototype, I upped the fidelity of the design, utilizing the Gemeente Delft style and expanding the designs to fit the reworked user flow that the team had created.
Alongside the design rework, I created a sturdier table for the prototype. The table that I initially built was structurally unsound, which led to some awkward Sprint Reviews in which the table was finicky and fragile in a way that didn't do our designs and programming justice.
The prototype was an attention grabber at the Expo, largely due to its unconventional nature in comparison to some other prototypes developed by other teams. Gemeente Delft was happy with the attention given to the project, and asked to keep the prototype to develop it further with a design agency that can do the project justice.
The prototype was an attention grabber at the Expo, largely due to its unconventional nature in comparison to some other prototypes developed by other teams. Gemeente Delft was happy with the attention given to the project, and asked to keep the prototype to develop it further with a design agency that can do the project justice.
Changing the Digital Twin space. When we started our project, every digital twin we found was so similar, they were essentially a visualized bank of information about whatever had been ‘Twinned’. We really wanted to revolutionize this concept and bring something new to the table (so to speak). To do this, we created a digital twin that promoted discussion, would help stakeholders emphasize, and would help the planning of Delft in a way that wasn’t so focused on the exact data of the city but rather the broader perspective. This really struck a chord with our client, and they identified strongly with our vision. This was quite helpful in the entire process of creating our product because this vision was always clear and always cosigned by our client. I think we changed the concept of what a Digital Twin can be and demonstrated to our client the value of interactivity and collaboration. I think our product definitely had a direct impact on our stakeholders, sparking an excitement in interactive technology and revolutionizing their own workflow.
Test everything always all the time. One of the lessons I learned during this project was to test absolutely everything multiple times in the exact same conditions that the upcoming presentation will be in before presenting it to the client. If the team would have learned this lesson much earlier, our sprint reviews would have gone much smoother. We learned our lesson before the Expo, though, and recreated the conditions that would be present by having more ambient light. This led to a much smoother presentation. Another lesson that I learned is that research is invaluable. The team was initially a bit lost on what our client wanted in the first sprint. However, once we had a meeting with them in which we interviewed them and asked questions about their needs, the vision for our product became much clearer. The last lesson that I learned is that clear communication between team members is absolutely essential to facilitate. This became apparent to me during the second sprint. Some team members were having struggles with their tasks and would work on the silently, trying to fix the problems with the Processing program, and were hitting roadblocks. However, once I learned of these issues, I was able to offer assistance and resources that helped to solve these roadblocks quickly. Sometimes thinking of a problem with a new head is effective for solving a pervasive issue.
UX / RESEARCH / DASHBOARD DESIGN
A 3 part tool including a wearable, mobile app, and ambient visualization that tracks and monitors
stress levels made for ex-offenders.
UX / RESEARCH / DASHBOARD DESIGN
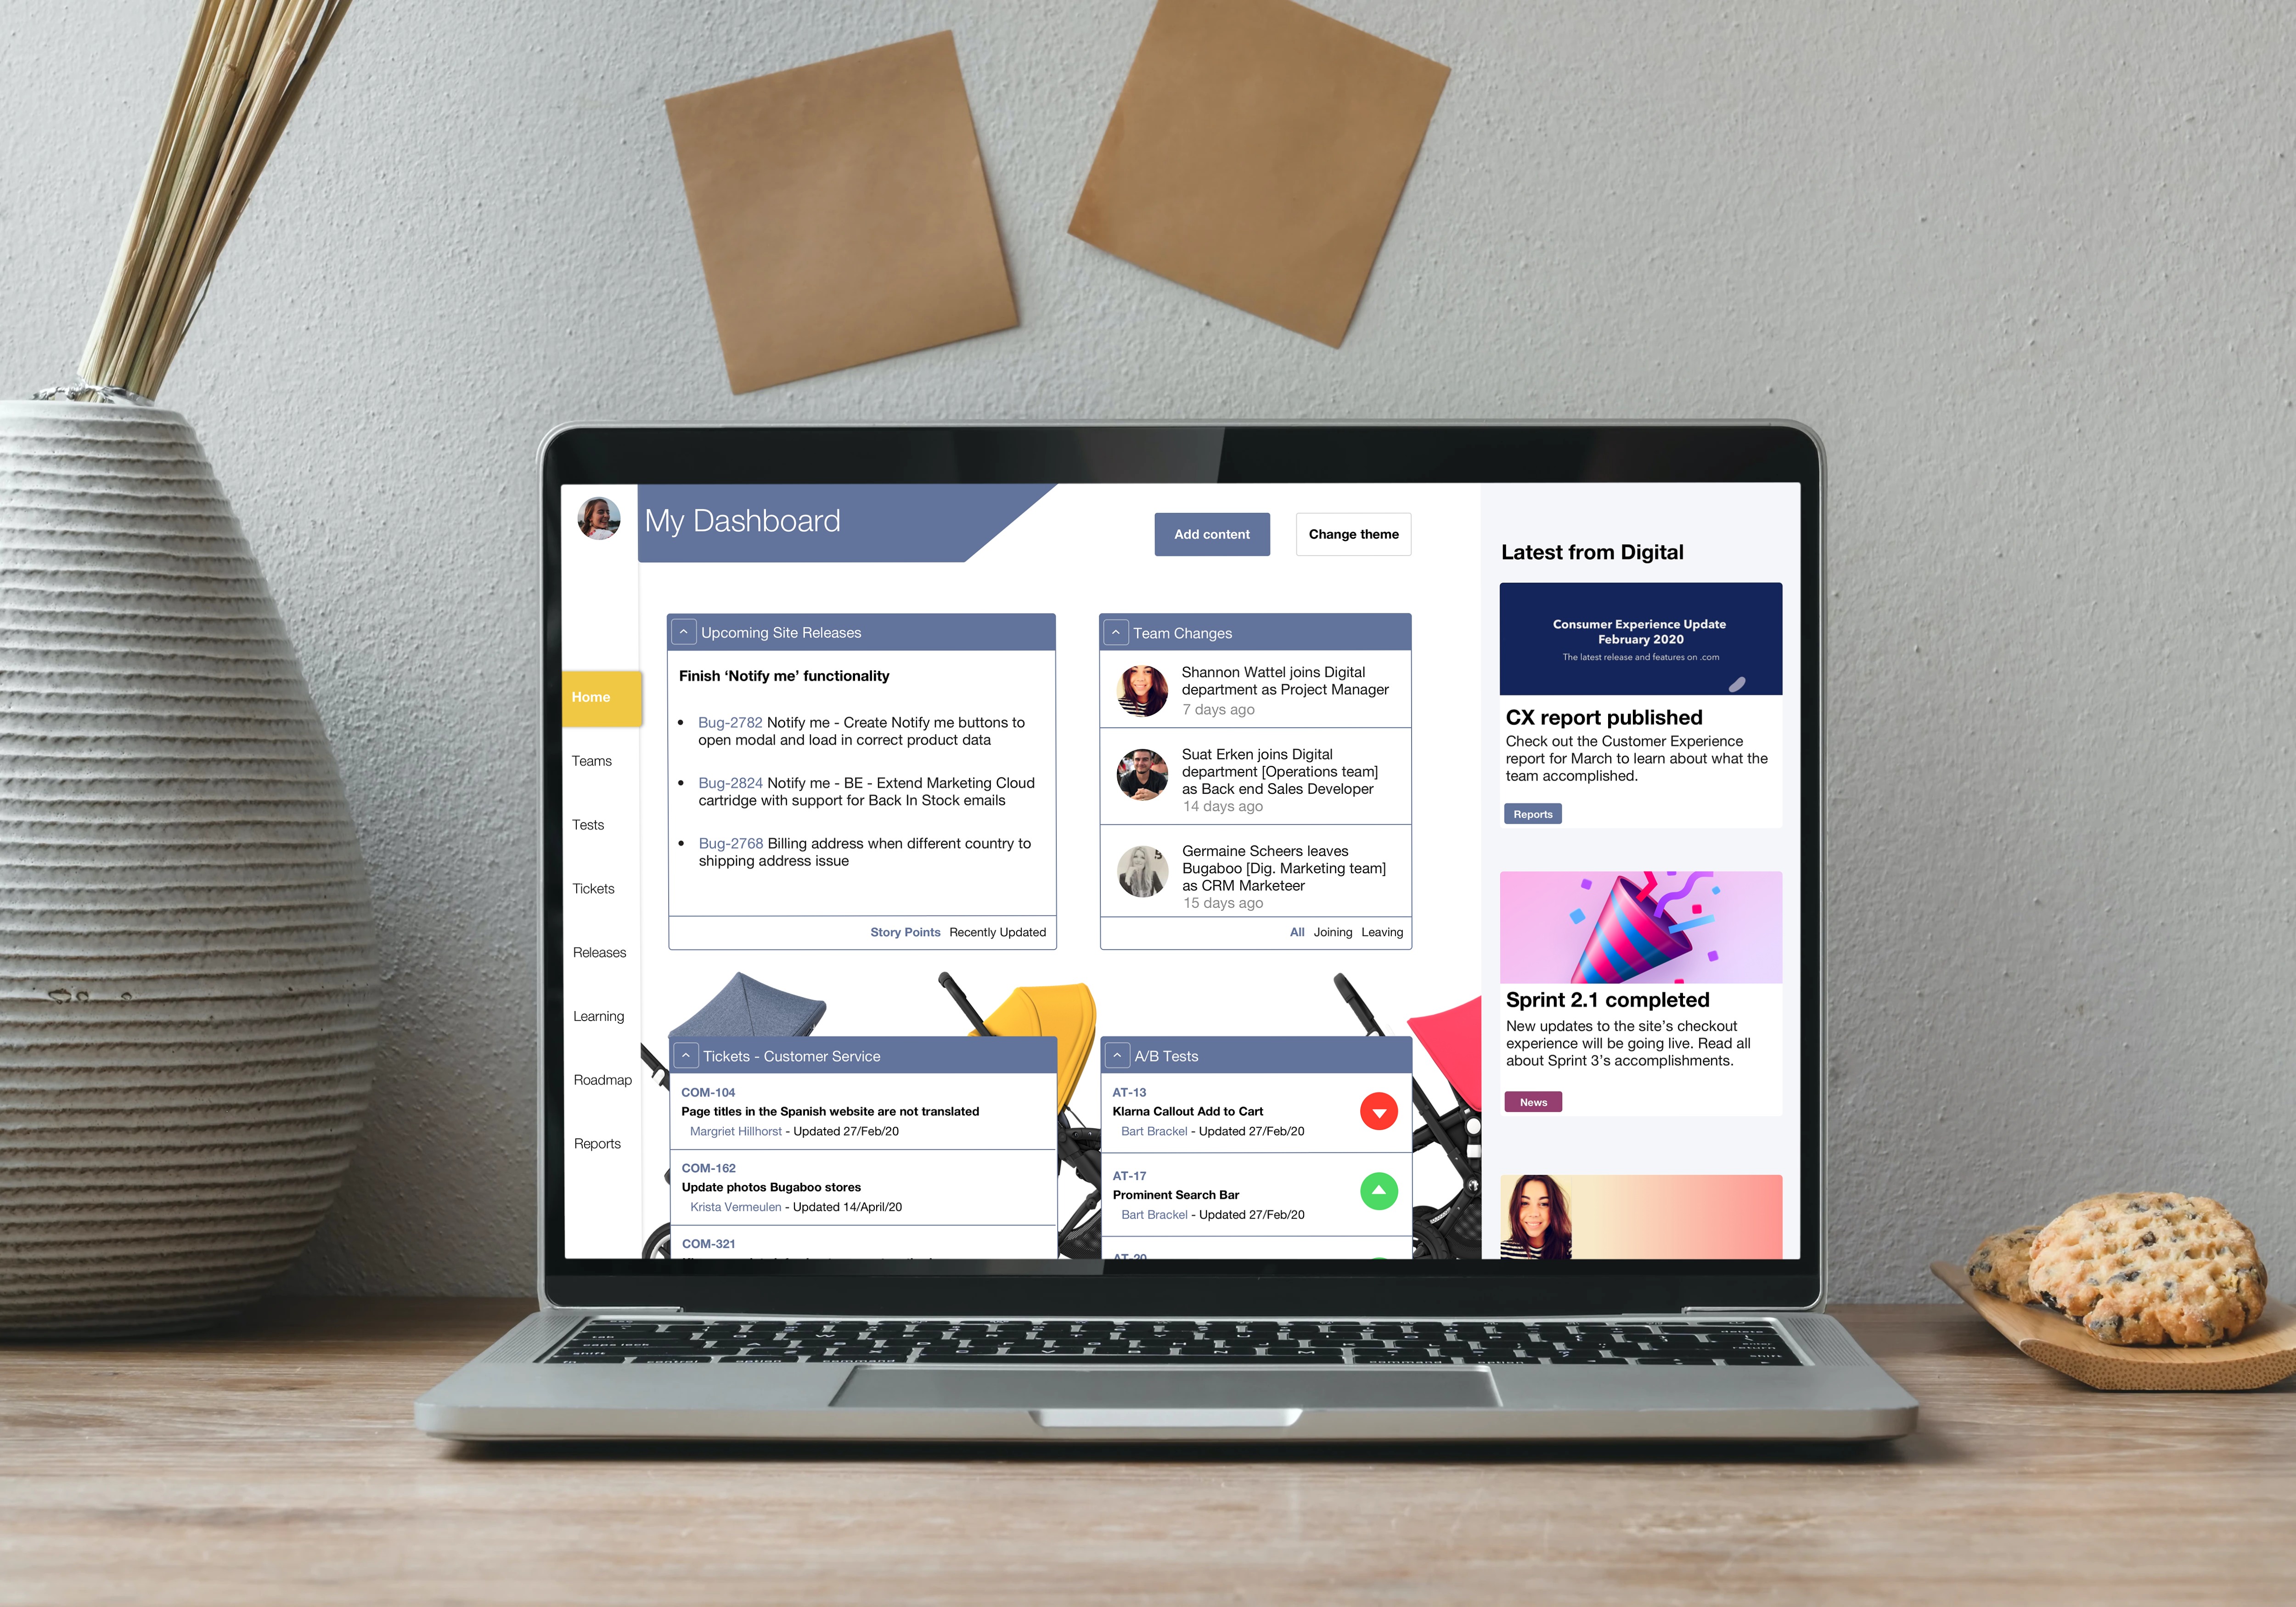
A dashboard built to increase interdepartmental communication and break down information silos at Bugaboo.